With the two dVIEWR data analysis methods, Covariance and Diffusion tensor distribution (DTD) (read more here), you can get unique parameter maps, i.e. contrasts.
Below is an example of a human-brain dataset featuring a Grade I meningioma in the left temporal lobe, accompanied by some peritumoral edema and free-water contamination.
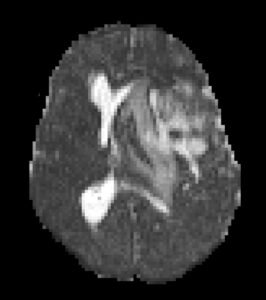
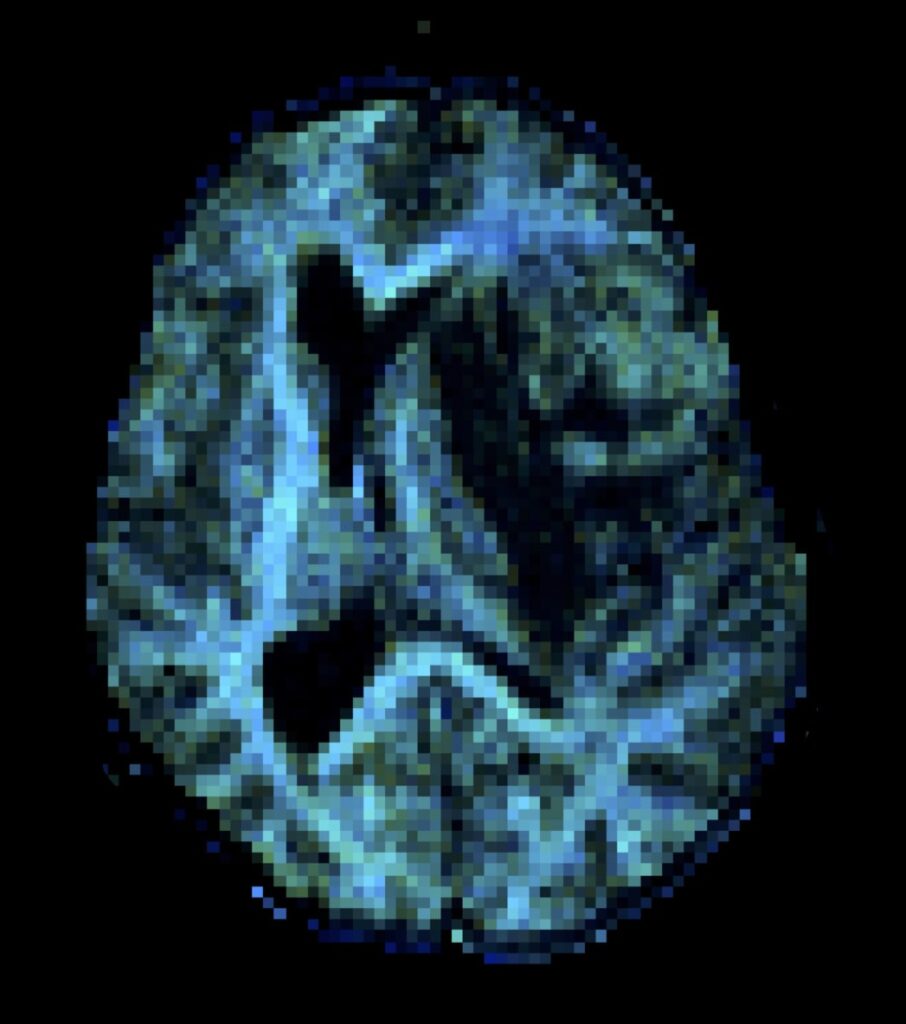
Mean diffusivity
[Covariance, DTD]
Equivalent to a conventional mean diffusivity map, obtainable using diffusion tensor imaging (DTI), this map indicates the average diffusivity across all sub-voxel diffusion environments. Within tissue, the mean diffusivity tends to inversely correlate with cell density.
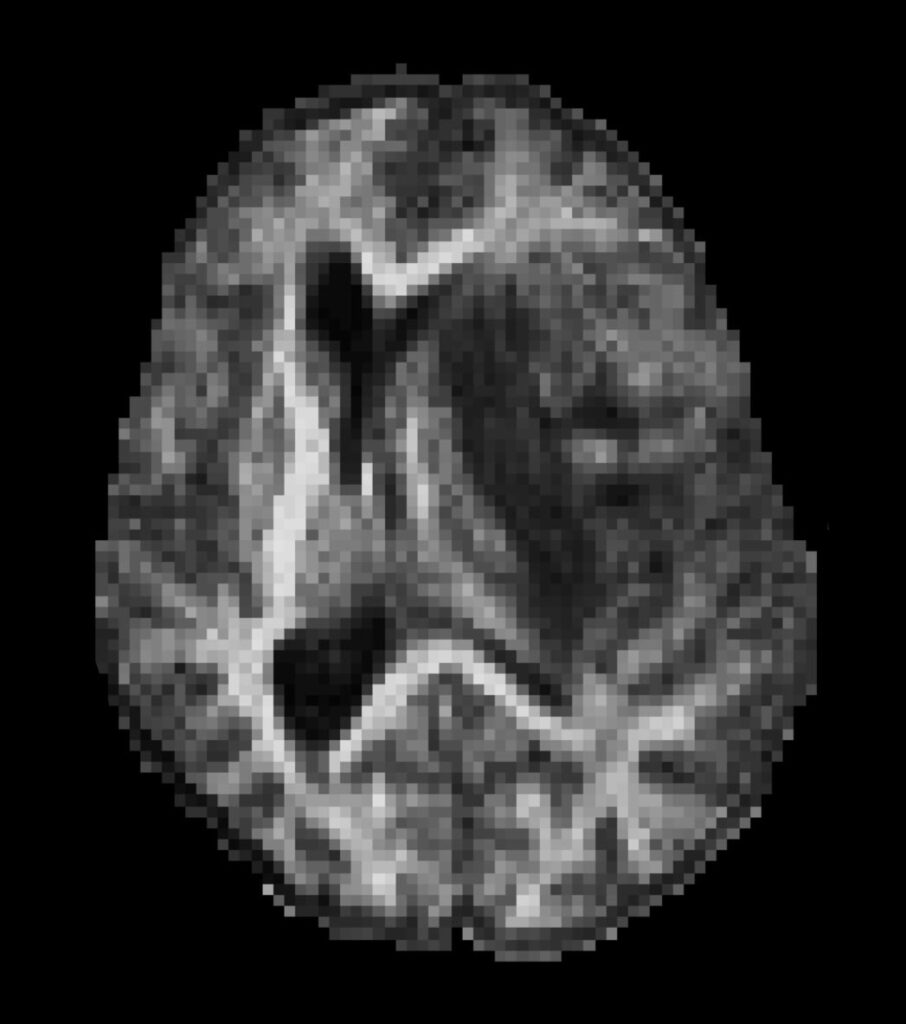
Microscopic anisotropy
[Covariance, DTD]
Indicates to which extent a given voxel contains elongated cells, disregarding (unlike fractional anisotropy) whether or not these are aligned. Note that both Covariance and DTD can also capture regular fractional anisotropy (FA) maps.
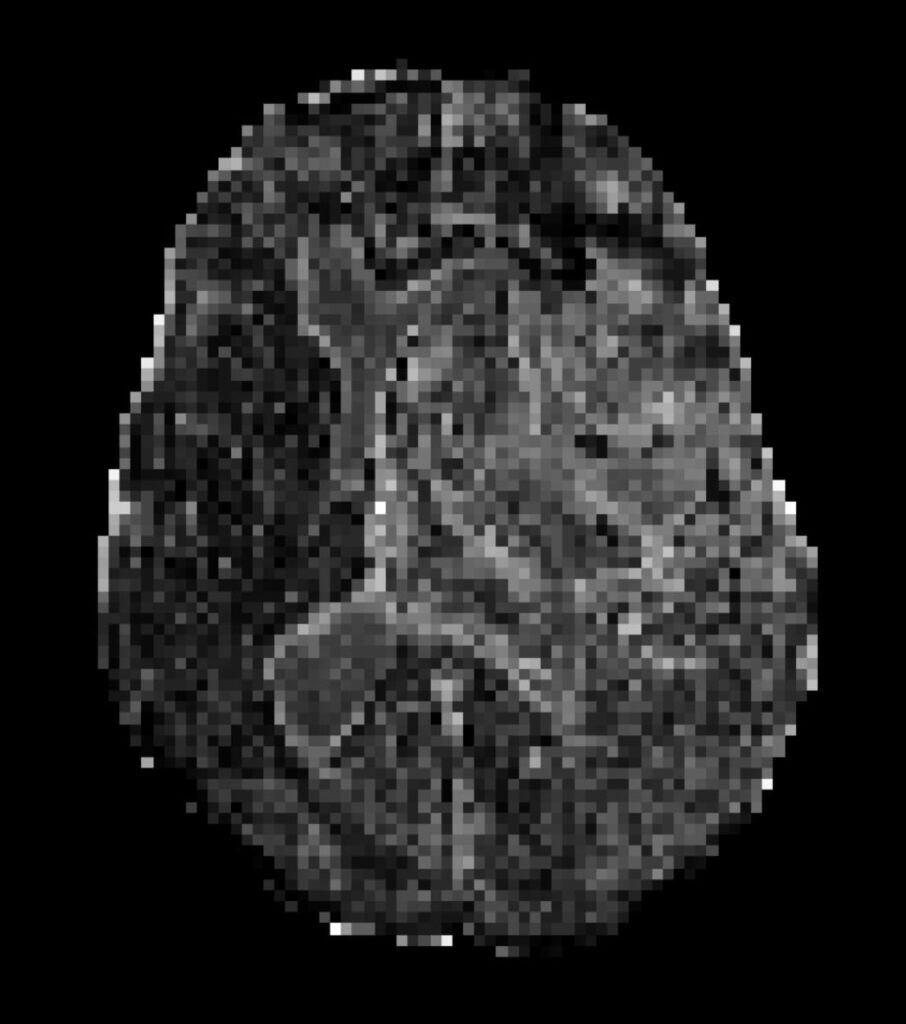
Diffusional variance
[Covariance, DTD]
Indicates the presence of sub-voxel environments with distinct mean diffusivities. For instance, it appears bright at the interface between white matter and the cerebrospinal fluid contained in the ventricles.
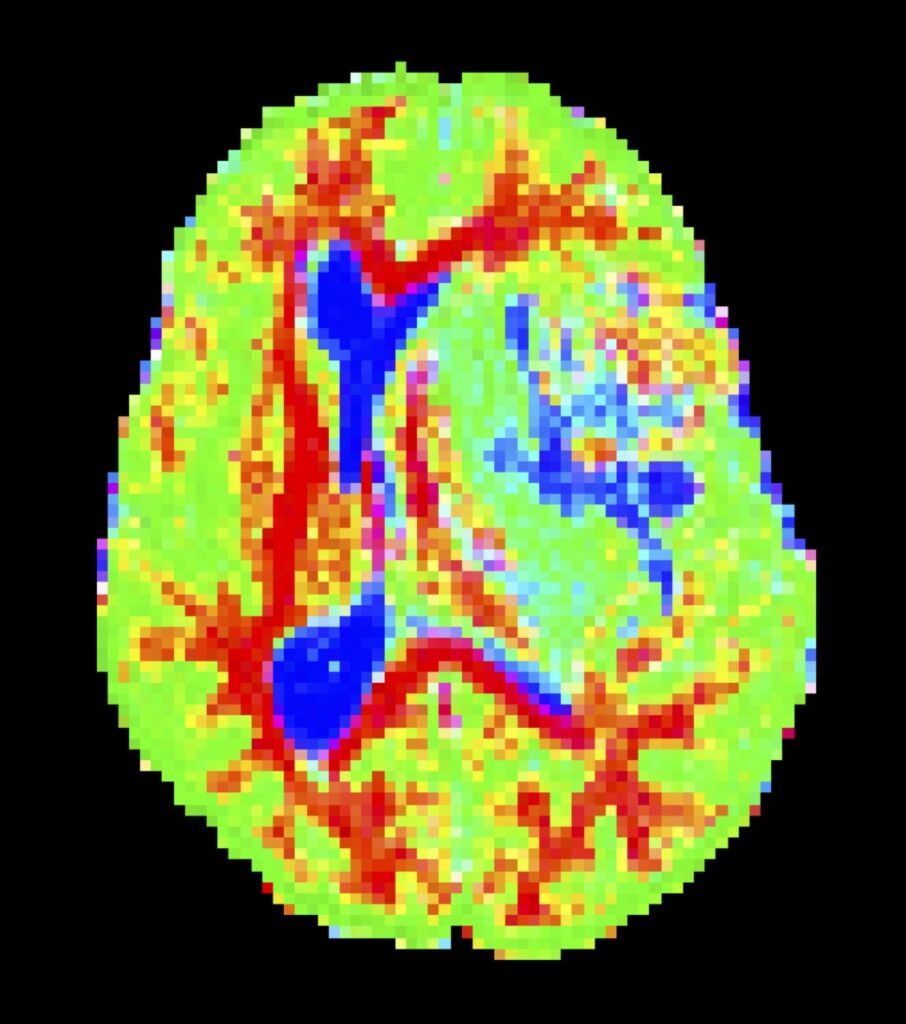
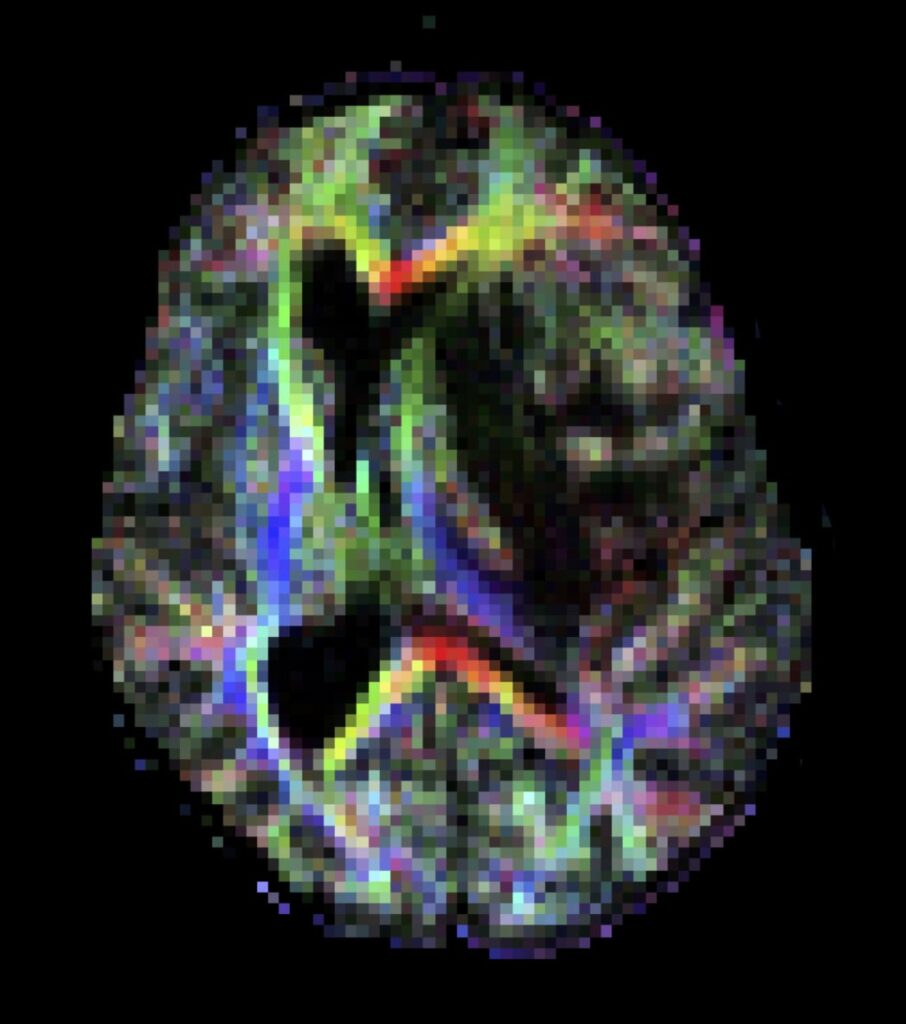
Segmentation map
[DTD]
The DTD method identifies bins isolating specific tissue types. Here, the “thin” bin (red) captures elongated cells (e.g. white matter). The “thick” bin (green) captures environments of low diffusivity and anisotropy (e.g. grey matter). The “big” bin (blue) captures free water. Voxels of secondary color (magenta,
yellow or cyan) contain a mixture of two distinct tissue types.
To enhance visualization of tissue properties, DTD specifically maps diffusion measures within each bin of the previous segmentation map.* The intensity of these maps is given by the signal fraction of their respective bin and are colored by the value of their diffusion measure of interest. Color coding goes from blue to red (minimal to maximal diffusion measure) using a colormap common to all bin-specific maps targeting the same diffusion measure of interest.
(*Shown here for mean diffusivity.)
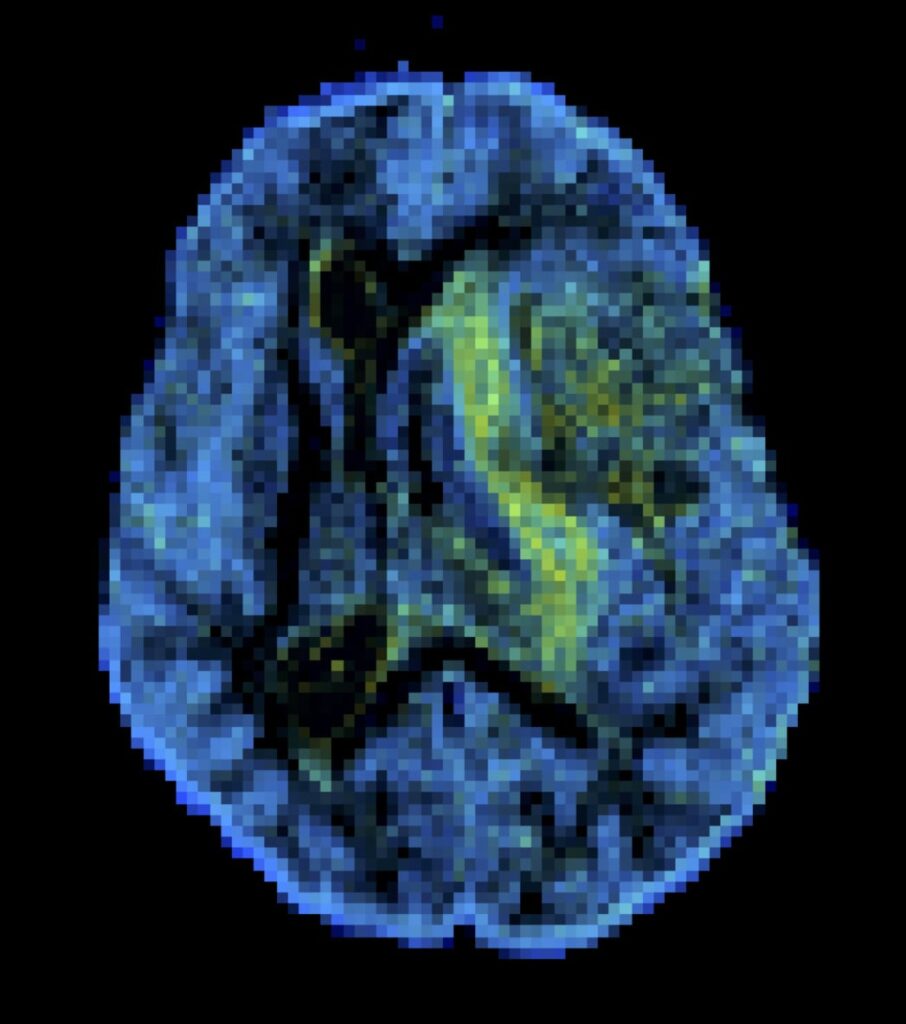
Thin-bin mean diffusivity
[DTD]
Bright in regions where elongated cells are located (e.g. white matter), indicates that the meningioma consists of fibrous tissue. In addition, this meningioma appears to share a low mean diffusivity similar to that of healthy white matter.
Thick-bin mean diffusivity
[DTD]
Bright in regions of low diffusivity and low anisotropy (e.g. grey matter), highlights the presence of peritumoral edema, whose mean diffusivity is larger than that of grey matter (green/yellow areas versus blue areas), yet lower than that of free water (which is captured by the big bin).
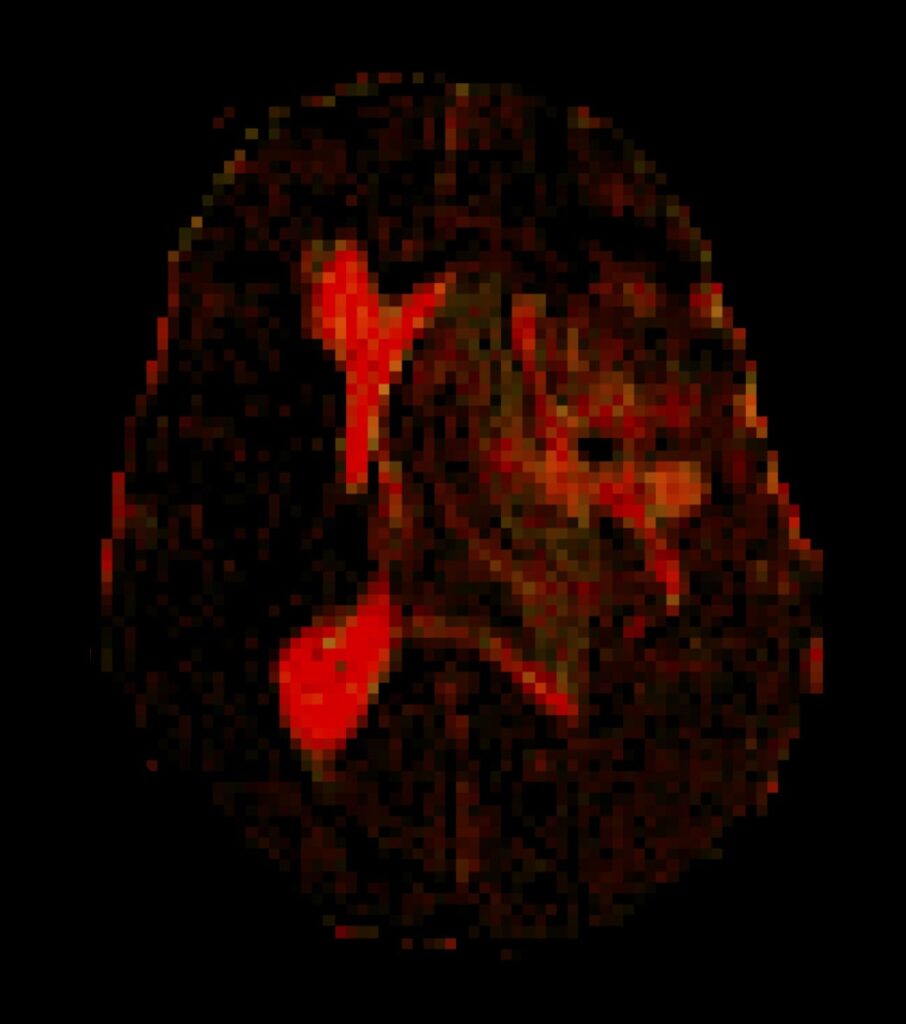
Big-bin mean diffusivity
[DTD]
Bright in regions containing free water, highlights the ventricles and indicates the presence of free-water contamination in the peritumoral area.
Thin-bin mean orientation
[DTD]
Encodes for the orientation of fibrous tissues according to [red, green, blue] = [left-right, anterior-posterior, superior-inferior]. While certain white-matter pathways appear to have been pushed by the meningioma, the relative whiteness of the latter indicates a low orientational order of its elongated cells.